

Bitcoin Market Cycle: Right-Translated vs. Left-Translated
DISCUSSION PAPER

(The views expressed in this paper are solely those of the author and do not constitute investment advice, recommendations, or a basis for making financial decisions. Readers should conduct their own research and seek professional guidance before engaging in any investment activities.)
Abstract
This paper discusses whether Bitcoin is entering a right- or left-translated cycle as of early March 2025. We argue based on six key macro and market indicators: M2 Global, Core PCE, NASDAQ Composite, ETF Net Flows, Unemployment Rate, and Fed Funds Rate. Both, right-translated (bullish scenario) and left-translated (bearish scenario) cases are considered, alongside key market implications.
1 Introduction
Bitcoin stands at a critical post-halving macroeconomic inflection point, with prices (1) surpassing previous highs while facing increasing macroeconomic uncertainty. The key question now is whether Bitcoin is tracking a right-translated cycle, char- acterized by an extended uptrend and delayed peak, or if it has already entered a left-translated cycle, signaling an early peak followed by a prolonged downturn. The outcome of this cycle determination has significant implications for investment strategies, risk management, and market positioning.
Amidst this uncertainty, macroeconomic risks are intensifying, largely driven by ongoing policy shifts within the current U.S. administration. Federal Reserve (Fed) decisions on interest rates, inflation control, and liquidity conditions continue to shape broader market sentiment, while institutional engagement in Bitcoin through ETFs fur- ther complicates price action.
To navigate this evolving landscape, we focus on six key indicators that historically influence Bitcoin’s cycle dynamics: M2 Global, Core PCE Inflation, NASDAQ Composite, ETF Net Flows, Unemployment Rate, and the Federal Funds Rate. By discussing and evaluating these macro and market factors, we aim to make the case for both, a right- or left-translated market cycle scenario.
The theory of the Four-Year Crypto Market Cycle is based on the idea that Bitcoin and the broader cryptocurrency market follow a repeating pattern driven largely by Bitcoin’s halving events - a programmed reduction in block rewards that occurs ap- proximately every four years. These cycles typically consist of four distinct phases: ac- cumulation, bull market, distribution, and bear market.
Historically, Bitcoin has exhibited a pattern where its price reaches a new all-time high 12–18 months after a halving, followed by a gradual decline leading into a bear market.
This cyclical behavior is often attributed to supply shocks caused by the halving, changes in market sentiment, and broader macroeconomic conditions affecting liquidity and risk appetite.
Each cycle has unique characteristics, but common trends include expansionary liq- uidity phases fueling speculative growth, followed by periods of contraction where over- leveraged positions unwind. Understanding these cycles is critical for evaluating whether Bitcoin is currently in a right-translated or left-translated cycle, as the market’s position- ing within the cycle can heavily influence investment strategies and price expectations.
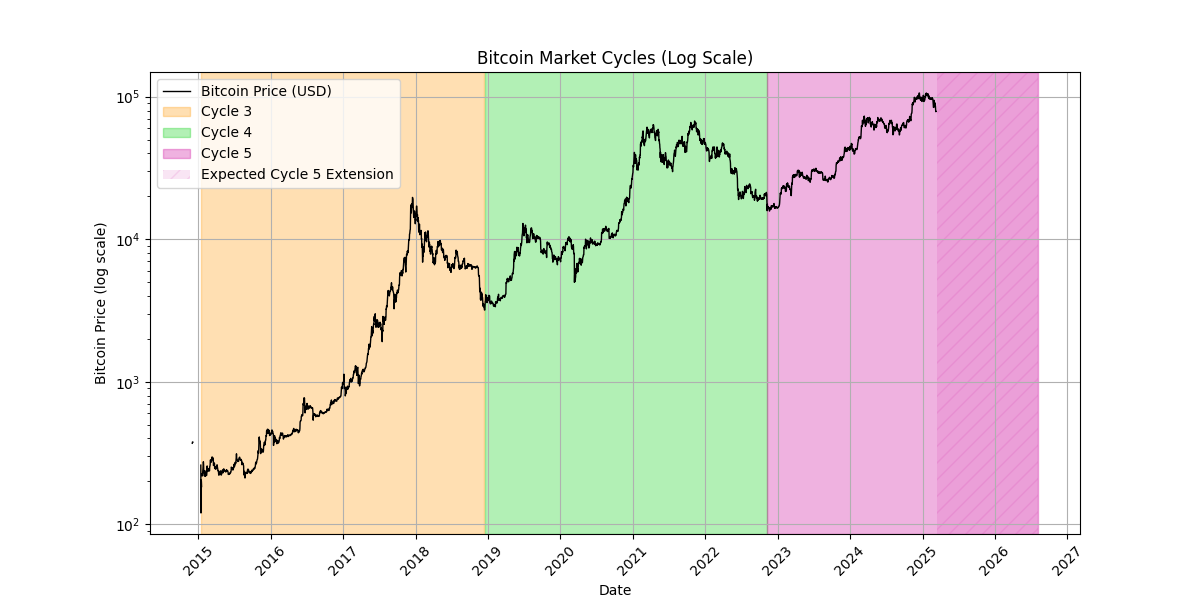
The current cycle measured from the previous cycle bottom began on November 9, 2022. Notably, for the first time in Bitcoin’s history, new all-time highs were achieved before the halving, which occurred on April 19, 2024. By December 2024, Bitcoin had already recorded a return on investment (ROI) of 400%, reaching a peak ROI of 673% since the last cycle bottom. However, since the inauguration of the new U.S. adminis- tration on January 20, 2025, Bitcoin’s price has declined by more than 25%, reflecting increased market uncertainty and potential macroeconomic shifts.
A Right-Translated Cycle occurs, when Bitcoin’s peak is reached approximately one year before the bear market bottom. Historically, Bitcoin has followed this pattern in previous cycles (2013-2017-2021), with three-year bull markets followed by a one-year bear market. This suggests that the current cycle may still have room for further growth, with a potential altcoin rally later in 2025.
A Left-Translated Cycle occurs, when Bitcoin peaks earlier than expected, leading to a prolonged and deeper bear market. This scenario played out in stock market cycles in 1966, 1972, and 1974, as well as during the dot-com bubble in 2000, where technology stocks peaked early and then entered a long decline. However, since the invention of Bitcoin in 2008, the crypto market has never seen a left-translated cycle.
2 Macro and Market Conditions – Q1 2025
In the following section, we analyze key indicators, examining their current trends, future outlook, and potential macroeconomic implications.
2.1 M2 Global Supply
Current Trend: Since 2015, the M2 Global (2) Money Supply has generally been in an expansionary phase, with growth accelerating during Bitcoin bull markets and slowing during bear markets. Notably, during the last bear market, before reaching its bottom in late 2022, global M2 supply contracted between August and October 2022.
Since then, it has resumed its expansion, reaching the high within this cycle of 7.09% year-over-year (YoY) growth in September 2024. However, this remains significantly below the peak levels observed in previous cycles:
Cycle 3: 14.1% YoY growth peak (February 2018)
Cycle 4: 19.44% YoY growth peak (February 2021)
Although the expansion decelerated in Q4 2024, it has since resumed its upward trajectory, aligning with the trend that began following the cycle bottom in late November 2022.

Outlook: The trajectory of the M2 Global Money Supply is closely tied to the Fed’s monetary policy, which currently remains in a wait-and-see approach, monitoring eco- nomic conditions as it assesses progress toward the 2% inflation target.
As Federal Reserve Chairman Jerome Powell stated during his last testimony (3) on February 11, 2025:
”The US is economy strong overall; inflation is closer to 2% goal but still somewhat elevated.”
Impact: If inflation declines more rapidly than anticipated, the likelihood of rate cuts will increase, potentially boosting market sentiment. Lower interest rates will also sup- port M2 expansion, as improved liquidity conditions encourage credit growth and capital inflows.
2.2 Core PCE Inflation
Current Trend: From early 2023 to June 2024, Core PCE (4) inflation steadily de- clined, reaching 2.63%. However, it then began to rise again, peaking at 2.9% in December 2024 before falling back to 2.6% in January 2025.
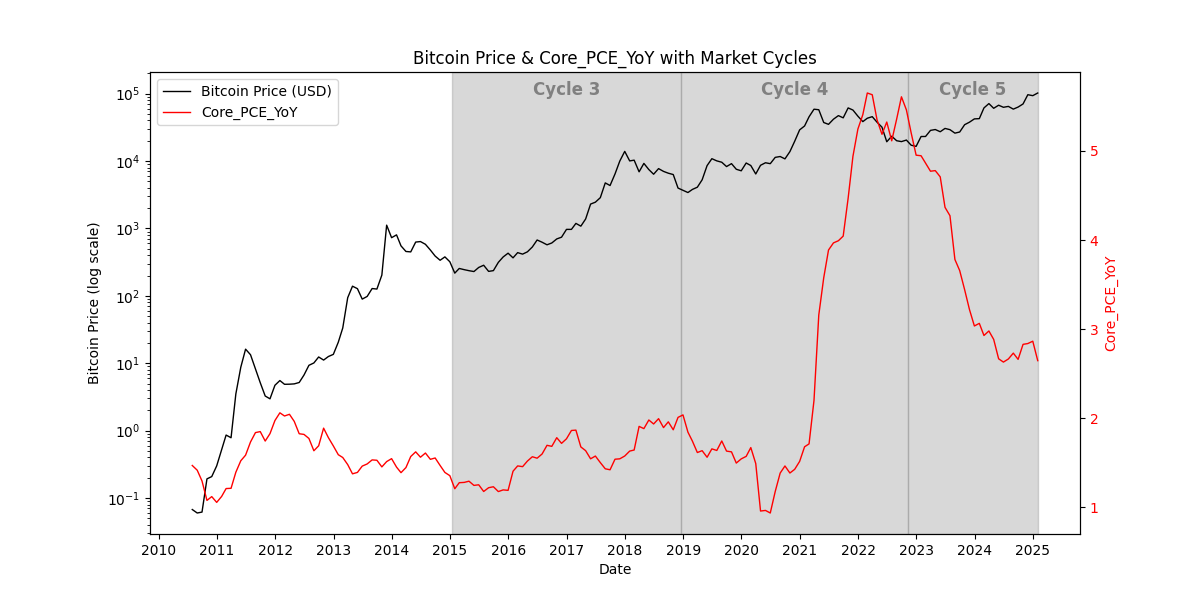
Outlook: Whether this downward trend will persist remains uncertain. However, it certainly will remain above pre-pandemic levels. The next Core PCE release is scheduled for March 28, 2025. Federal Reserve Chairman Jerome Powell emphasized during his last testimony (3) on February 11, 2025, that
”We can maintain policy restraint for longer if the economy remains strong and inflation does not move toward 2%.”
Fed policy decisions and unemployment trends will determine whether inflation stabilizes or rebounds. The risk of stagflation needs to be monitored.
Potential Impact: Persistent inflation above the Fed’s 2% target increases the likeli- hood of further monetary tightening, posing liquidity risks for risk assets. In response, the Fed may maintain higher interest rates for longer and continue quantitative tightening (QT), reducing overall market liquidity.
For Bitcoin, tighter liquidity conditions typically lead to higher volatility and downside risk, as seen in previous cycles where Bitcoin prices have correlated with shifts in Fed policy. Additionally, equity markets, particularly growth stocks, may struggle under prolonged high rates, creating a broader risk-off sentiment.
If inflation remains elevated, the Fed’s restrictive stance can signal a left-translated cycle, with Bitcoin having peaked early in Q1 2024. Conversely, if inflation cools faster than expected, the Fed may shift toward further rate cuts in late 2025, providing liquidity support and increasing the likelihood of a right-translated cycle.
2.3 Unemployment Rate
Current Trend: Since July 2023, the Unemployment Rate (5) has followed an upward trajectory, rising from 3.5% to 4.2% by November 2024. Since then, it has stabilized around 4.1%, with no clear directional trend.
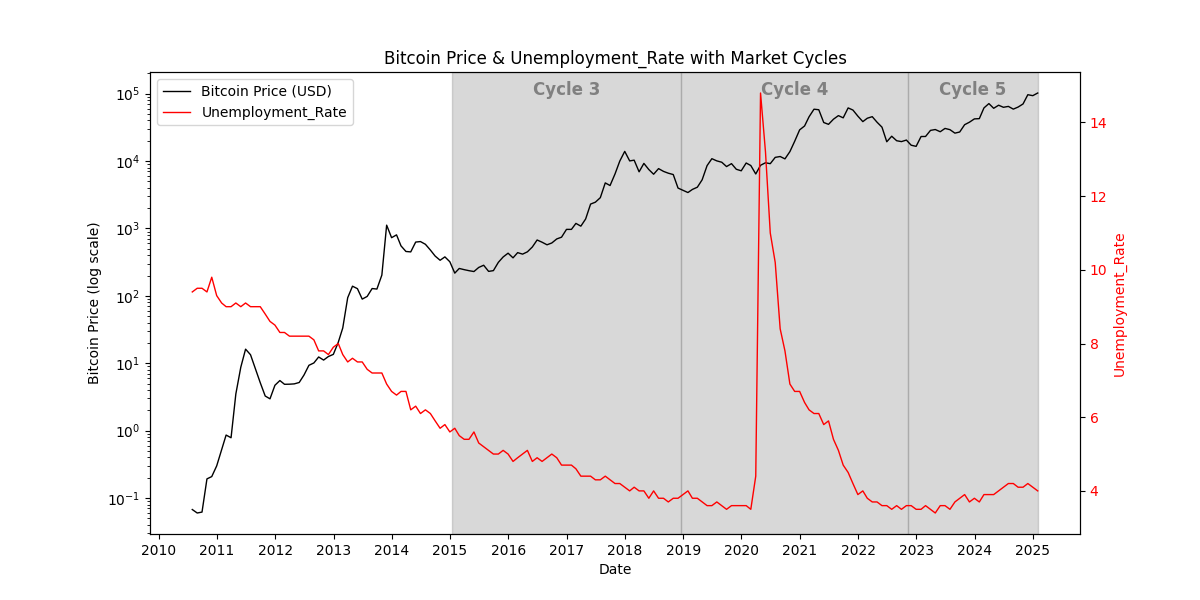
Outlook: The upcoming April 4, 2025 jobs report, the first full employment report under the new administration, will serve as a key benchmark for assessing the impact of President Trump’s economic policies on the U.S. labor market. Particular attention will be on the layoffs and contract cancellations initiated by Elon Musk and the Depart- ment of Government Efficiency (DOGE), as these measures can significantly influence employment trends. The DOGE layoffs are expected to have a growing impact on up- coming labor market data, fueling speculation about rising unemployment and increasing concerns over broader economic stability and recession risks.
Impact: A sustained increase in unemployment is a key indicator of economic weakness and often precedes broader recessionary conditions. As businesses reduce hiring and initiate job cuts, consumer spending declines, further slowing economic activity. A rising unemployment rate can intensify market uncertainty, leading to a shift in sentiment and increased fears of an economic downturn. If job losses extend across multiple sectors, concerns over a broader contraction in economic output grow, reinforcing expectations of a recession.
If unemployment rises sharply, the Fed may be pressured to pause or cut interest rates earlier than expected to stabilize the labor market and support economic growth. Lower interest rates can ease financial conditions, improving liquidity availability across markets.
However, if inflation remains persistent despite rising unemployment, the Fed can face a difficult trade-off: either maintaining higher-for-longer rates to combat inflation, at the risk of deepening economic distress, or pivoting toward rate cuts to support job growth while potentially allowing inflationary pressures to persist. The balance between these policy choices will be crucial in shaping overall macroeconomic conditions in 2025.
2.4 Fed Funds Rate
Current Trend: After steadily raising the Federal Funds Rate (6) since March 2022, the Fed maintained a plateau at a 550 bps target range before initiating rate cuts in September 2024. However, since December 2024, the rate has remained unchanged at 450 bps.

Outlook: The Fed’s next policy meeting, where the updated target rate range will be announced, is scheduled for March 19, 2025, with market expectations indicating a range of 425–450 bps. During his last testimony, Federal Reserve Chairman Jerome Powell emphasized (3) the data-driven nature of monetary policy decisions, stating:
”The Fed makes its decisions based on what’s happening in the economy.”
Whether the current administration’s policies have had a sufficient impact to justify further Fed action remains to be seen.
Impact: Lower interest rates stimulate lending and credit expansion, increasing overall liquidity in the financial system. As a result, more capital becomes available, leading to greater inflows into financial markets. Conversely, if rate cuts are delayed, financial conditions remain tight, keeping borrowing costs elevated and dampening growth expectations.
2.5 NASDAQ Composite
Current Trend: Following the post-pandemic recovery, the NASDAQ Composite (7) surged to 16,057, reaching its peak in November 2021, coinciding with Bitcoin’s second peak within its fourth cycle. The index then entered a prolonged decline, bottoming out at 10,213 in December 2022, strongly correlating with the final phase of the last crypto bear market. Subsequently, the NASDAQ Composite rebounded, reaching a new all-time high of 20,173 in December 2024. However, after staying in that range, the index has been trending down since mid February 2025, currently hovering around 17,500.

Outlook: In post-election years, the NASDAQ has historically followed a seasonal pat- tern, declining from the second week of February until early April before rebounding and trending up for the rest of the year. Therefore, the recent downturn may not necessarily indicate a prolonged trend. However, the heightened uncertainty surrounding the current U.S. administration’s policies can exert additional pressure on equities, leaving room for further volatility.
Impact: Historically, Bitcoin’s price has exhibited a strong correlation with equities. A downturn in equity markets can lead to weakened investor confidence in speculative assets, increasing selling pressure on cryptocurrencies, particularly in a left-translated cycle. Conversely, under an expansive monetary policy, a rebound in equities can serve as a catalyst for renewed bullish sentiment in the crypto market.
2.6 ETF Net Flows
Current Trend: Throughout 2024, ETF Net Flows (8) remained predominantly pos- itive, with consistent daily growth until peaking in early November. As Bitcoin ap- proached the $100,000 mark, daily net inflows began to decline, and instances of negative net flows became more frequent, particularly around Christmas 2024. This trend intensi- fied throughout January 2025, culminating in substantial outflows starting on February 21, 2025. Since then, net flows have remained negative, though gradually stabilizing at lower levels.

Outlook: While negative net flows have gradually declined since reaching their deepest trough on February 26, 2025, they remain consistently negative, exceeding $100 million per day. Whether this trend will reverse into sustained positive net flows in the short term remains uncertain.
Impact: The significant outflows observed since late February 2025 suggest waning institutional confidence in the market. If net flows remain negative for an extended period, this can serve as a bearish signal, indicating sustained selling pressure and potential downside risk.
3 Discussion
3.1 Left-Translated Cycle Scenario
Case: With Bitcoin reflecting risk-off sentiment since February 2025, the likelihood of a left-translated cycle has become increasingly relevant. In contrast to previous post- halving cycles, where Bitcoin’s peak typically occurred 12–18 months after the halving, this scenario suggests that Bitcoin may have already reached its cycle high on January 20, 2025. By continuously delaying further rate cuts, the Fed keeps liquidity tight and weakening stock markets drag Bitcoin lower. This means, the market is about to enter a prolonged bear phase lasting up to 1.5 years, if aligning with the time frames observed in the last two cycles.
Support:
ETF adoption absorbed liquidity too early. The introduction of U.S. spot Bitcoin ETFs in January 2024 led to massive institutional inflows in Q3 and Q4 2024. Bitcoin ETFs absorbed liquidity during a phase of expanding M2 Global Supply, creating an early demand surge that front-loaded buying pressure and was unique to this cycle.
Bitcoin reached an all-time high before the halving. In all previous cycles, Bitcoin’s all-time high (ATH) came 12-18 months after the halving. This cycle, Bitcoin hit an ATH at $73K$ before the April 2024 halving - a first in Bitcoin’s history.
Liquidity tightened post-Q2 2024. While M2 Global expanded during Q1 and Q2 2024, liquidity conditions tightened in Q3 and Q4 as the Fed maintained high interest rates and repeatedly postponed rate cuts before finally lowering rates to 475 bps in December 2024.
ETF netflows have turned negative. Since February 2025, ETF Net Flows turned negative, suggesting institutions are de-risking or taking profits.
NASDAQ Composite and Bitcoin are showing correlated weakness. His- torically, Bitcoin has followed a risk-on/risk-off pattern with equities. The NAS- DAQ Composite peaked in Q4 2024, and since then, market sentiment has weak- ened.
Quantitative Easing is not the Fed’s tool of choice. The Fed has not signaled any immediate plans for Quantitative Easing (QE). Powell even stated during his last testimony (3):
”Would use quantitative easing only when rates are at zero.”
Validity: The early peak in ETF-driven demand has reduced the likelihood of a sus- tained post-halving rally, including a blow-off phase. Net inflows from Bitcoin ETFs turned negative in Q1 2025, indicating that institutional investors are already taking profits rather than accumulating, limiting further upside potential. In past cycles, the post-halving supply shock was a key driver of price appreciation. However, this cycle deviates from historical norms as Bitcoin peaked pre-halving, suggesting that demand was pulled forward and exhausted earlier than expected.
While the U.S. economy has avoided recession longer than anticipated, recession risks remain. A risk-off environment can further dampen institutional demand for Bitcoin, re- inforcing downward price pressure. Additionally, the Fed’s cautious stance has restrained speculative sentiment, preventing the retail-driven euphoria that typically characterizes late-cycle market behavior. Meanwhile, M2 Global liquidity growth has slowed, and el- evated borrowing costs are constraining new debt issuance, limiting the flow of fresh capital into risk assets.
If the stock market enters a prolonged correction, Bitcoin is unlikely to decouple and may face continued selling pressure. Historical left-translated market cycles, such as the 2000 dot-com crash and the 2007 financial crisis, saw tech stocks peaking early, only to decline sharply. Bitcoin, strongly correlated with equities and representing a liquidity- sensitive asset, follows a similar trajectory.
3.2 Right-Translated Cycle Scenario
Case: The recent 30% decline in Bitcoin’s price remains within the bounds of a typical market correction, given the asset’s historically high volatility in an open and liquid mar- ket (comparable to April–May 2021). This does not necessarily indicate a deviation from the expected right-translated cycle structure. Based on the last two cycles, Bitcoin is projected to reach its cycle peak approximately 1,050 days after the previous market bot- tom, placing the expected peak in early Q4 2025. In the mid-term, supportive economic policies from the current U.S. administration, along with expected monetary easing from the Fed in early H2 2025, provide the foundation for renewed market growth.
Support:
Post-election year market weakness is historically temporary. Historically, post-election years tend to be weak for equities from February to April before rallying in the second half of the year.
Historical cycle timing still leaves room for a second peak. The past two market cycles have lasted for 12-18 months post-halving before topping out.
M2 Global money supply has been expanding again. Despite a resumed growth phase in H2 2024, the M2 Global has been expanding again, increasing available liquidity.
Inflation is slowly decreasing towards the Fed’s 2% target. After taking a break from its rapid decrease in H2 2024, the Core PCE (YoY) is again on track reaching the Fed’s target rate of 2% setting the ground for looser financial conditions.
Unemployment is not rising. The Unemployment Rate has stabilized rather than surging with the labor market remaining strong enough to prevent a full eco- nomic contraction. Historically, deep bear markets require rising unemployment, which is not occurring.
ETF net outflows have been declining again. Recent data shows declining outflows suggesting that at some point inflows will resume and lead to renewed institutional demand.
Validity: Historically, the right-translated cycle has been the base case in previous Bitcoin market cycles, following a typical 12–18 month post-halving rally. The current downturn in Q1 2025 appears to be seasonal rather than cyclical, largely influenced by post-election year market weakness, which has historically resolved with a recovery in the second half of the year.
Macroeconomic indicators suggest that the risk of a severe recession remains lower than feared, reducing the likelihood of further liquidity tightening. The labor market re- mains stable, with unemployment rates not surging, allowing for continued economic ex- pansion. Additionally, inflation is steadily declining toward the Fed’s 2% target, strength- ening expectations for rate cuts in H2 2025. If the Fed follows through on this, looser financial conditions will result in M2 expansion, improving overall market liquidity and risk-on sentiment.
ETF net outflows have been gradually declining, indicating that selling pressure is easing. A shift from net outflows to net inflows will signal a renewed phase of institutional demand, which reinforces the right-translated scenario. If these factors align positively, Bitcoin will follow historical cycle timing, with a potential cycle peak in early Q4 2025.
4 Conclusion
Both a right- and left-translated cycle scenario can be supported by strong arguments, reflecting the market’s current state of macroeconomic uncertainty. Core macro indicators have yet to establish sustained long-term trends, which may be attributed to the new U.S. administration’s mixed and partly contradictory policies. However, such uncertainty is not uncommon in early post-election years. Ultimately, the key determining factor will be the trajectory of monetary policy leading into summer 2025, particularly whether M2 Global expands, as historical data suggests a strong correlation between its growth and Bitcoin price developments.
So far, the Fed has refrained from reintroducing rate hikes, primarily due to stabilizing unemployment rates. Additionally, declining inflation supports the case for further rate cuts. If this trend continues and unemployment remains stable or declines, the probability of monetary easing increases, strengthening the foundation for a right-translated cycle with renewed, growing demand.
However, the long-term economic implications of the administration’s policies, par- ticularly its re-industrialization agenda and reshoring efforts, must be closely monitored. Recent layoffs and potential increases in the unemployment rate can negatively impact sentiment, reducing the probability of expansionary fiscal policies. Additionally, the introduction of new tariffs introduces further uncertainty. While tariffs may temporarily boost domestic employment, the higher import costs can drive inflation higher, poten- tially delaying Fed rate cuts and tightening liquidity conditions.
In a broader sense, measuring the effectiveness of re-industrialization efforts will pro- vide further insight into the administration’s economic policy success. A well-executed industrial strategy can increase market confidence and improve future sentiment, while policy missteps can reinforce bearish market conditions. The interplay between monetary easing, employment trends, and trade policy impacts will ultimately determine whether Bitcoin follows a right- or left-translated cycle in the coming months.
From mid-April 2025, with fresh labor market and inflation data available, along with another Fed testimony, the probabilities of a left- versus right-translated cycle will become clearer.
Thank you for reading & sharing!
Download the original discussion paper as PDF here.